


School Achievement and Results
We strive for exceptional standards across all subjects and for all of our pupils. Little Waltham's pupils make very good academic progress and achieve very well compared to their peers nationally.
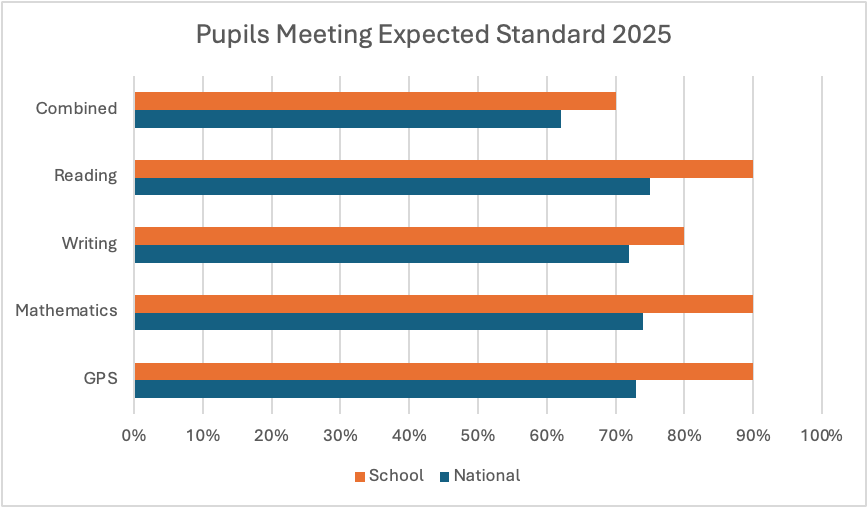
Pupils Meeting The Expected Standard At The End Of Key Stage 2 2025
| Number of pupils in cohort | % of pupils meeting standard | National Average | Average Scaled Score | School vs National | Overall | |
| Combined (Reading, Writing, Mathematics) | 30 | 70% | 62% | N/A | +8% | Above national average |
| Reading | 30 | 90% | 75% | 109 | +15% | Significantly above national average |
| Mathematics | 30 | 90% | 74% | 109 | +16% | Significantly above national average |
| Writing | 30 | 80% | 72% | N/A | +8% | Above national average |
| Grammar, Punctuation, Spelling | 30 | 90% | 73% | 108 | +17% | Significantly above national average |
| Science | 30 | 80% | 82% | N/A | -2% | Just below national average |
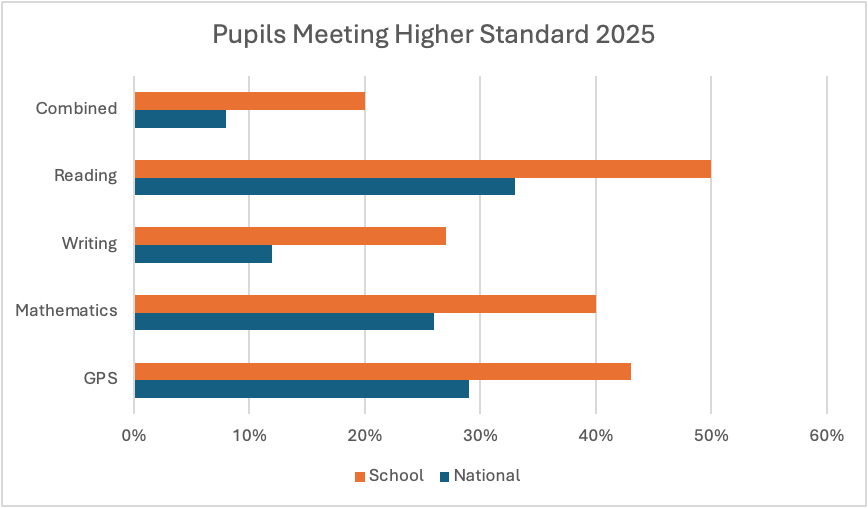
Pupils Meeting The Higher Standard (Greater Depth) At The End Of Key Stage 2 2025
| Number of pupils in cohort | % of pupils meeting standard | National Average | School vs National | Overall | |
| Combined (Reading, Writing, Mathematics) | 30 | 20% | 8% | +12% | Significantly above national average |
| Reading | 30 | 50% | 33% | +17% | Significantly above national average |
| Mathematics | 30 | 40% | 26% | +14% | Significantly above national average |
| Writing | 30 | 27% | 12% | +15% | Significantly above national average |
| Grammar Punctuation and Spelling | 30 | 43% | 29% | +14% | Significantly above national average |
Early Years Foundation Stage 2025
| Cohort | School | National | |
| % of pupils achieving a good level of development | 30 | 70% | 69% |
| % of pupil at the expected level across all early learning goals | 30 | 70% | 67% |
| Average number of early learning goals at the expected level per pupil. | 30 | 15.2 | 14.2 |
Phonics Screening Check (Year 1) 2024
| Number of pupils in cohort | School | National | |
| % of pupils passing in Year 1 | 27 | 81% | 80% |
| % of pupils passing check by the end of Year 2 | 30 | 90% | 91% |
Multiplication Tables Check (Year 4) 2024
| School | National Average | |
| % of pupils scoring full marks (25/25) | 31% | 38% |
| Average Score out of 25 | 20.6 | 21.1 |
Further information can be viewed on the Schools and College Performance Measures website (Currently 2023 data).
Standards from previous years
Pupils Meeting The Expected Standard At The End Of Key Stage 2 2024
| Number of pupils in cohort | % of pupils meeting standards | National Average | Average Scaled Score | School vs National | Overall | |
| Combined (Reading, Writing and Mathematics) | 42 | 79% | 61% | N/A | +18% | Significantly above national average |
| Reading | 42 | 90% | 74% | 110 | +16% | Significantly above national average |
| Mathematics | 42 | 93% | 73% | 108 | +20% | Significantly above national average |
| Writing | 42 | 81% | 72% | N/A | +9% | Above national average |
| Grammar, Punctuation and Spelling | 42 | 88% | 72% | 108 | +16% | Significantly above national average |
| Science | 42 | 93% | 81% | N/A | +12% | Significantly above national average |
Pupils Meeting The Higher Standard (Greater Depth) At The End Of Key Stage 2 2024
| Number of pupils in cohort | % of pupils meeting standards | National Average | School vs National | Overall | |
| Combined (Reading, Writing and Mathematics) | 42 | 19% | 8% | +11% | Significantly above national average |
| Reading | 42 | 57% | 28% | +29% | Significantly above national average |
| Mathematics | 42 | 40% | 24% | +16% | Significantly above national average |
| Writing | 42 | 31% | 13% | +18% | Significantly above national average |
| Grammar, Punctuation, Spelling | 42 | 33% | 32% | +1% | Above national average |
Early Years Foundation Stage 2024
| Number of pupils in cohort | School | National Average | |
| % of pupils achieving a good level of development | 28 | 79% | 68% |
| % of pupils at the expected level across all early learning goals | 28 | 79% | 66% |
| Average number of early learning goals at the expected level per pupil | 28 | 14.8 | 14.1 |
Phonics Screening Check (Year 1) 2024
| Number of pupils in cohort | School | National Average | |
| % of pupils passing in Year 1 | 25 | 74% | 80% |
| % of pupils passing check by the end of Year 2 | 32 | 94% | 89% |
Multiplication Tables Check (Year 4) 2024
| Number of pupils in cohort | School | National Average | |
| % of pupils scoring full marks | 33 | 24 | 34 |
| Average score (out of 25) | 33 | 22.6 | 20.2 |